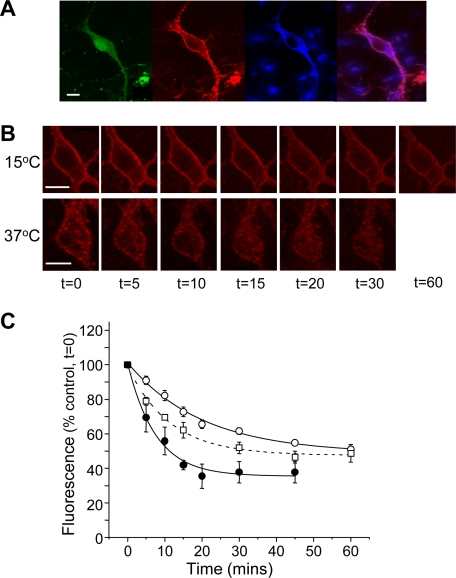
FIGURE 5.
Rate of endocytosis for R1aBBSR2 receptors can be monitored in hippocampal neurons. A, image of a hippocampal neuron transfected at 7DIV with R1aBBS, R2, and GFP cDNAs (FITC, green). At 14DIV, 3 μg/ml BTX-Rhd was applied (rhodamine, red) prior to being fixed and permeabilized. Additionally, an R2 C-terminal antibody with Cy5 (blue) secondary was applied. Scale bars, 10 μm. Merged image (without FITC) is shown. B, images of live neurons expressing R1aBBSR2 subunits at 15 °C (upper panel) and 37 °C (lower panel). C, time course of surface fluorescence for live neurons expressing R1aBBSR2 subunits at 37 °C (•), 22 °C (□), and 15 °C (○); n = 4–6.

