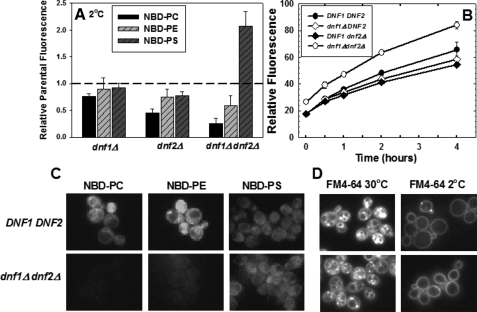
FIGURE 1.
NBD-PS flip is not dependent on Dnf1p or Dnf2p. A, early log phase cells, grown in YPD media (A600 = 0.2-0.4) were labeled with 5 μm NBD-PC or NBD-PE or 10 μm NBD-PS at 2 °C for 1 h. Cells were washed three times with ice-cold SC-azide and analyzed by flow cytometry as described under “Experimental Procedures.” The following strains were used: DNF1DNF2 parent strains BY4242 and BY4141; dnf1Δ (LMY165); dnf2Δ (LMY166); and dnf1Δdnf2Δ (HCY13). Data are normalized to parental NBD-phospholipid internalization of the appropriate mating type, although no significant differences were observed between mating types. The relative fluorescence following internalization of NBD-PC, NBD-PE, and NBD-PS in the parental strain BY4141 was 353 ± 33, 260 ± 22, and 146 ± 10, respectively. Data are the mean of at least three independent experiments, and the error bars represent the S.D. between experiments. B, time course of NBD-PS internalization measured by flow cytometry. The same strains used for panel A were labeled as described above, except the labeling time was varied from 0 to 4 h. C, fluorescence images of NBD-phospholipids internalized at 2 °C in DNF1DNF2 (BY4141) and dnf1Δdnf2Δ (HCY13) strains. Images were scaled identically and are representative of the entire field. D, fluorescence images of FM4-64 internalization in the same strains used in C at 2 °C and 30 °C. Cells were grown as in A and labeled with 20 μm FM4-64 (16.5 mm stock in DMSO) for 30 min at 2 °C or 30 °C before washing and imaging. The intensity of the images acquired at 2 °C was increased 2.5 times that of the 30 °C images.

