FIGURE 8.
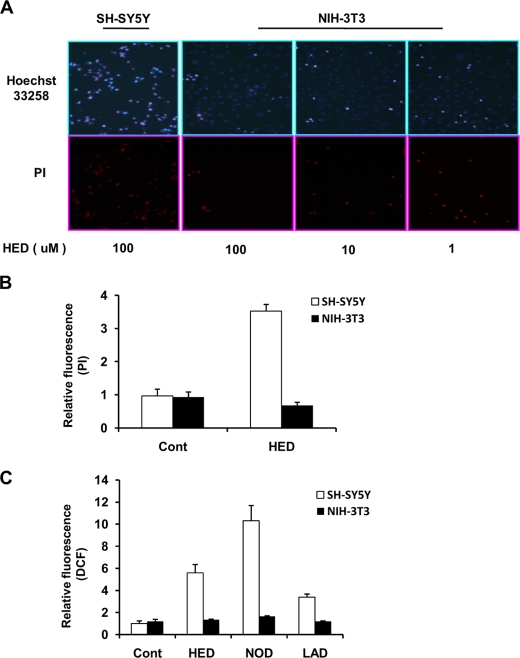
No cytotoxicity was induced by HED in NIH3T3 cells compared with in SH-SY5Y cells. A, apoptotic cells imaging. NIH3T3 cells were treated with different concentrations of HED for 12 h. PI and Hoechst staining were performed by fluorescence microscope. B, numbers of apoptotic cells. The apoptotic cells were analyzed by PI staining by using a flow cytometer. C, ROS generation. The fluorescence of DCF was measured by flow cytometer. The data are shown in B and C as the means ± S.D. (n = 3). Cont, control.

