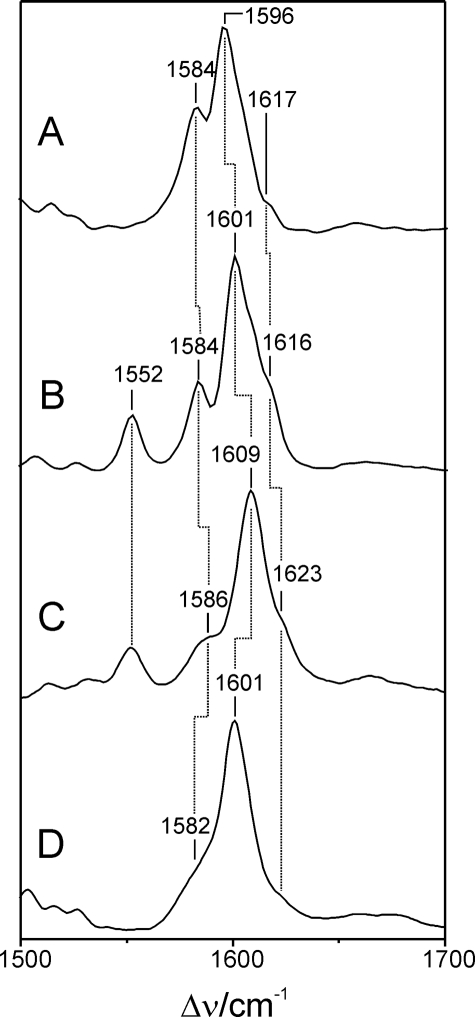
FIGURE 6.
RR spectra of the Pfr states of FphAN753 and DrBphP from D. radiodurans, measured from samples dissolved in H2O and D2O. The spectra display the marker band region in an expanded view. A, FphAN753 and D2O; B, FphAN753 and H2O; C, DrBphP and H2O; and D, DrBphP and D2O. Spectra of DrBphP were taken from a previous study (20).

