FIGURE 3.
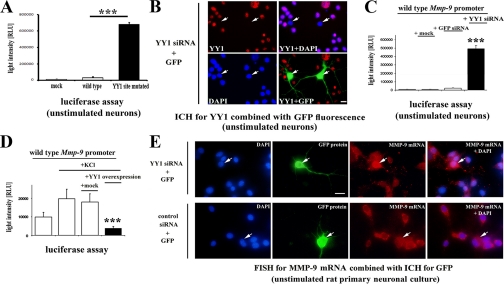
YY1 acting via -333/-322-bp site of Mmp-9 promoter is a potent and essential transcriptional repressor of MMP-9 in neurons. A, footprinted -333/-322-bp site of the rat Mmp-9 promoter exerts a repressive influence on Mmp-9 promoter activity in rat neurons. Luciferase activities recorded after lipofection of the unstimulated rat primary neuronal cultures with constructs containing either WT or -333/-322-bp site mutated (YY1 site mutated) rat Mmp-9 promoters controlling luciferase gene. Mock indicates results obtained after a lipofection of a backbone of Mmp-9 promoter constructs. Error bars represent the mean ± S.D. (n = 5; ***, p < 0.001). B, YY1 immunocytochemical staining (in red) of the unstimulated rat primary neuronal culture co-lipofected with YY1 and GFP siRNA expression constructs. Cell nuclei are stained with DAPI (in blue); GFP is green. Scale, 20 μm. White arrows indicate the lipofected cells. C, depletion of YY1 leads to a robust induction of the rat Mmp-9 promoter activity in the unstimulated rat neurons. Luciferase activity recorded after co-lipofection of luciferase controlled by the WT rat Mmp-9 promoter with either empty vector (mock), or control siRNA (GFP siRNA) expression construct, or YY1 siRNA expression construct is presented. Error bars represent the mean ± S.D. (n = 5; ***, p < 0.001). D, YY1 overexpression results in a repression of the rat Mmp-9 promoter activity in the depolarized neurons. Luciferase activity recorded after co-lipofection of luciferase under control of the WT rat Mmp-9 promoter with one of the following constructs: GW1 empty vector (mock), YY1 expression construct (YY1 overexpression). Error bars represent the mean ± S.D. (n = 5; ***, p < 0.001). +KCl indicates the cultures at 2 h after KCl-evoked excitation. E, YY1 critically represses endogenous MMP-9 transcription in the unstimulated rat neurons. Fluorescent in situ hybridization for MMP-9 mRNA is shown along with immunocytochemistry for GFP in the unstimulated cultures co-lipofected with the GFP and with either YY1 or control (cortactin) siRNA expression constructs. MMP-9 mRNA is shown in red, and cell nuclei are presented in blue (DAPI) and GFP immunofluorescence in green. White arrows indicate the lipofected cells. Scale bar, 20 μm.

