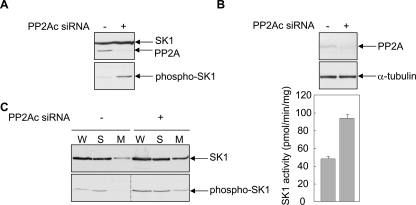
FIGURE 8.
Silencing PP2Ac expression increases SK1 phosphorylation, activity and the proportion of membrane-localized SK1. A, HEK293 cells were transfected with vectors encoding FLAG-tagged SK1 and HA-tagged PP2Ac, in the presence of siRNA targeting the PP2A catalytic subunit (+) or a negative control siRNA (-). Total SK1 and PP2Ac expression levels in the cell lysates were assessed by immunoblotting with anti-FLAG and anti-HA antibodies, respectively (upper panel) and levels of phosphorylated SK1 were assessed using an antibody recognizing phospho-SK1 (lower panel). Results are representative of triplicate transfections. B, HEK293 cells were transfected with either siRNA targeting the PP2A catalytic subunit (+), or a negative control siRNA (-). Cell lysates were immunoblotted with an antibody recognizing the PP2A catalytic subunit (upper panel), and equal protein loading was confirmed using an antibody recognizing α-tubulin (middle panel). Results are representative of triplicate transfections. The lower panel shows the mean (±range) for duplicate determinations of endogenous SK1 activity measured in the cell lysates and is representative of duplicate transfections. C, HEK293 cells were transfected with a vector encoding FLAG-tagged SK1, in the presence of siRNA targeting the PP2A catalytic subunit (+) or a negative control siRNA (-). Whole cell extracts (W), soluble fractions (S), and membrane-enriched fractions (M) were prepared from the transfected cells, which were then assessed for levels of total SK1 (upper panel) and phospho-SK1 (lower panel), by immunoblotting with anti-FLAG and anti-phospho-SK1 antibodies, respectively. Results are representative of three experiments. The dividing lines indicate where lanes have been spliced to simplify viewing, but results in each panel are from a single experiment.

