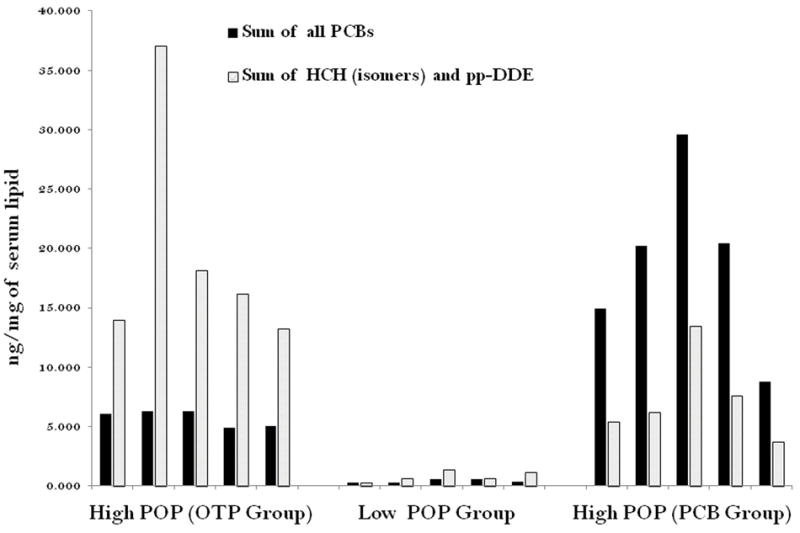
Figure 1.

Distribution of POP components in the subjects selected for microarray experiments: High POP (OTP Group) means, high total POP value in their blood (>75 percentile) and Other Than PCB of POP component / PCB > 1; High POP (PCB Group) means high total POP value in their blood (>75 percentile) but PCB / Other Than PCB of POP component > 1. Low POP Group (Control): low total POP value in their blood (< 25 percentile).
