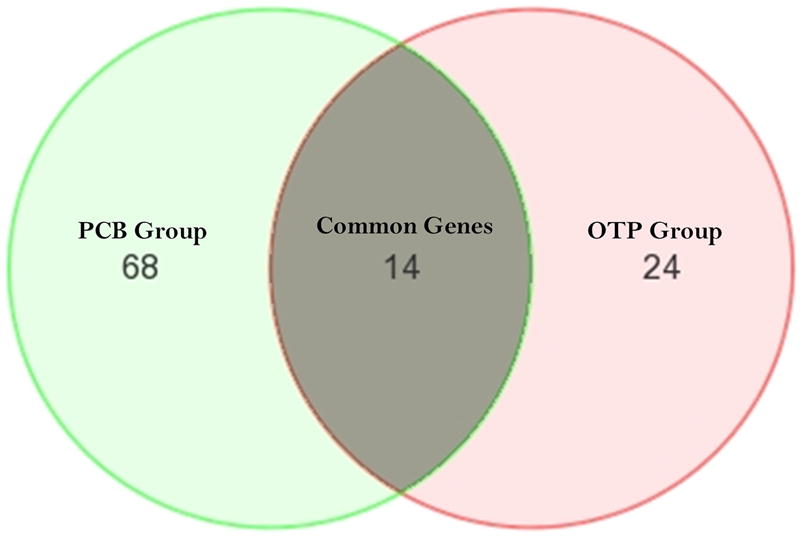
Figure 3.

Venn diagram represented the distribution of the two differentially expressed gene sets. 14 genes were common in both gene sets. 24, and 68 genes were differentially expressed exclusively in OTP Group (A), PCB Group (B).

Venn diagram represented the distribution of the two differentially expressed gene sets. 14 genes were common in both gene sets. 24, and 68 genes were differentially expressed exclusively in OTP Group (A), PCB Group (B).