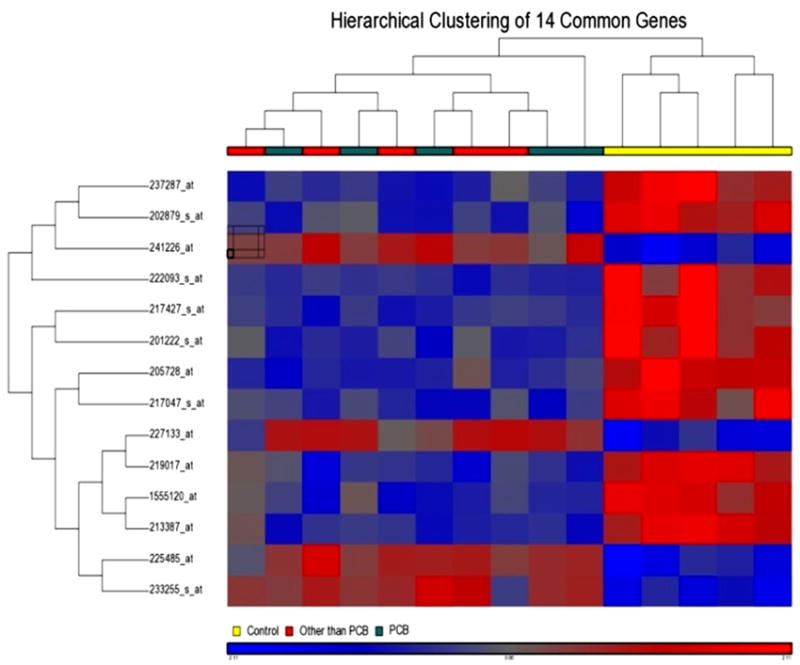
Figure 4.

Hierarchical cluster analysis of the differentially expressed common gene set between two exposure groups: Dendrogram displayed the clustering results systematically and color mosaic display provided a visual support for the 14 differentially expressed genes, up regulated, red and down regulated, blue. The legend color for subject groups are: OTP red, PCB green and Control yellow.
