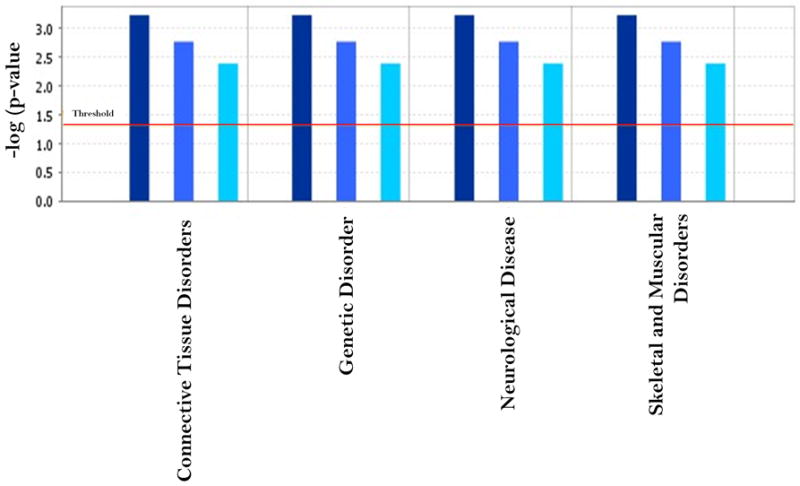
Figure 5.

The comparison of significant disease disorder function generated by IPA based on the 14 common genes between the OTP and PCB group and the total differentially expressed gene sets in the two groups. The threshold line in the bar chart represents a p-value of 0.05. Dark blue, blue and light blue represented the common, OTP and PCB group respectively.
