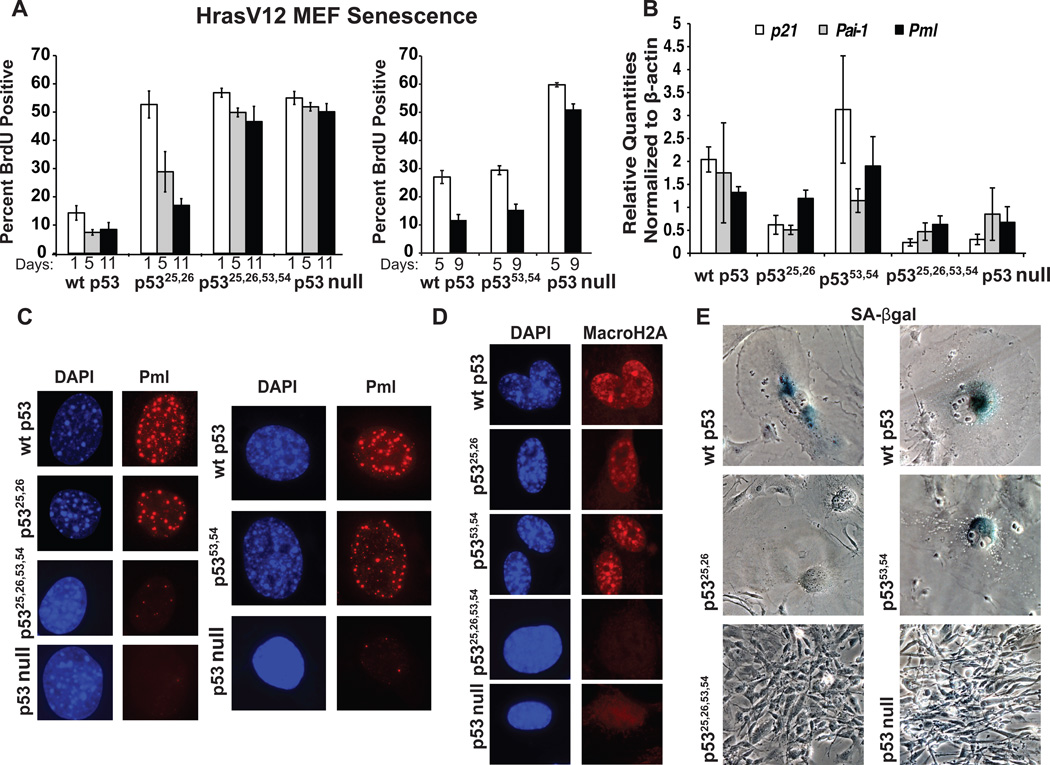
Fig. 4. p5325,26, but not p5325,26,53,54, induces cellular senescence in HrasV12 MEFs.
(A) Average percentages of BrdU-positive cells over time. Left: HrasV12-expressing p53+/+, p53LSL-25,26/LSL-25,26, and p53LSL-25,26,53,54/LSL-25,26,53,54 MEFs were infected with Ad-Cre and cultured. Total percentages of p53-positive cells displaying BrdU positivity are shown. Right: HrasV12-expressing p53+/+, p5353,54/53,54, and p53LSL-53,54/LSL-53,54 (p53 null) MEFs were cultured and analyzed for BrdU incorporation. The timelines under the graphs denote either days post-Ad-Cre (performed 4 days after HrasV12 transduction; left) or days after HrasV12 transduction (right, where Ad-Cre is not used). Averages +/− SEM of at least 3 cell lines per genotype are graphed. (B) qRT-PCR analysis of the expression of the senescence-related target genes p21, Pai-1, and Pml in HrasV12 MEFs (C) Pml immunostaining of HrasV12 MEFs at the final timepoints of senescence assays. DAPI stains nuclei. (D) MacroH2A staining of HrasV12 MEFs at the final timepoints of senescence assays. DAPI stains nuclei. (E) Phase contrast images of SA-β-galactosidase staining and morphology of HrasV12 MEFs at the final timepoints of senescence assays. See also Figure S2.

