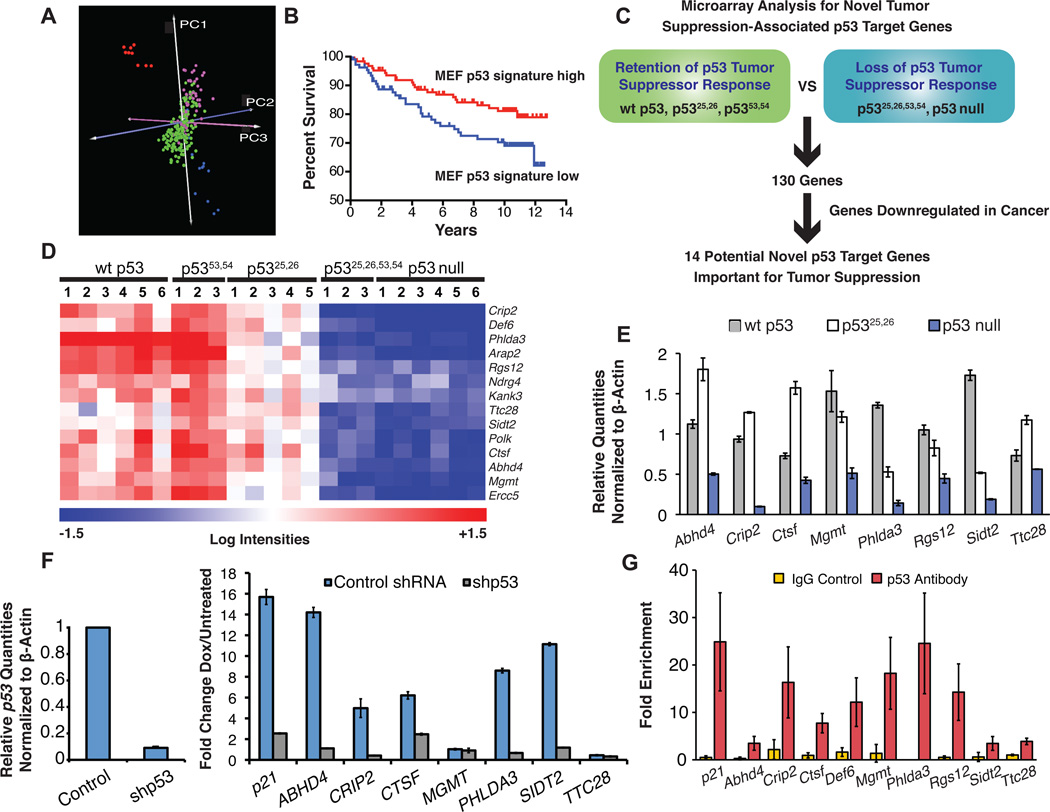
Fig. 6. Microarray analysis to identify p53 targets associated with tumor suppression.
(A) Gene expression profiles of HrasV12 MEFs from p53 genotypes that retain wild-type p53 tumor suppressor activity (wt p53, p5353,54/53,54 and p5325,26/25,26) were compared to those lacking p53 tumor suppressor activity (p5325,26,53,54/25,26,53,54 and p53 null). Those genes expressed at least 2-fold and 1.5 standard deviations higher in the wild-type group relative to the p53 null group were used as a p53 signature to predict p53 status of human breast cancer samples by PCA (Miller et al., 2005; Blue= wt p53, p5353,54 and p5325,26 MEFs, red= p5325,26,53,54 and p53 null MEFs, green=p53wt human breast cancers, pink=p53mut human breast cancers). (B) Kaplan-Meier curves demonstrate the effectiveness of MEF p53 signature in stratifying human breast cancer samples by patient survival; p=0.0422, log rank test. (C) Schematic showing approach to identify p53 target genes potentially involved in tumor suppression. (D) Heat map displaying the 14 genes meeting the filtering criteria described in (C). (E) qRT-PCR validation showing the average expression levels +/− SD of target genes in HrasV12 MEFs homozygous for wt p53, p5325,26, or p53 null alleles, after normalization to β-actin. (F) Induction of target genes by DNA damage is p53-dependent in GM00011 human fibroblasts. qRT-PCR demonstrates the efficacy of p53 knockdown with p53 shRNA compared to scrambled control shRNA (left) and the p53-dependence of target gene induction after 24 hrs of treatment with 0.2 µg/ml dox (right). Values are the averages of 3 replicates +/− SD. (G) ChIP for p53 binding to consensus sites in target genes in wild-type MEFs treated with 0.2 µg/ml dox for 6 hrs. IgG antibody serves as a negative control. Values represent the fold enrichment of binding to the p53 consensus site compared to binding to an irrelevant gene desert site and are the average of 3 replicates +/− SD. See also Figure S3.

