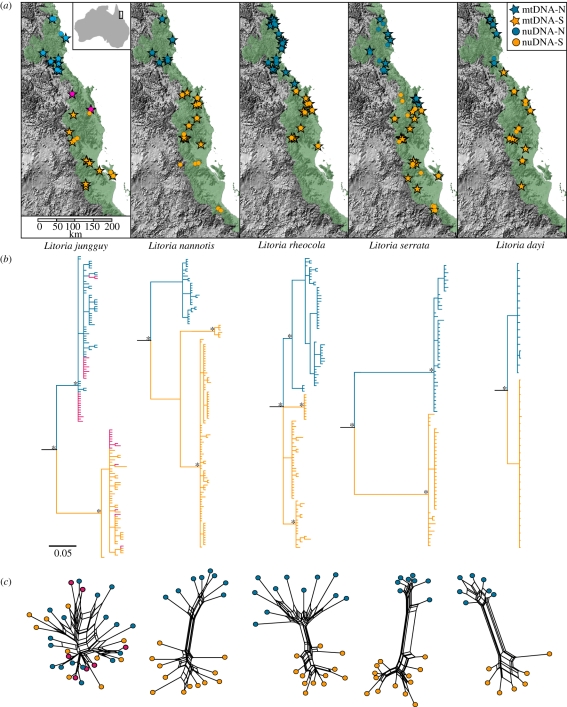
Figure 1.
(a) Localities for mtDNA and nuDNA sampling for each species, relative to the distribution of the AWT rainforest. (b) mtDNA trees for each species. Posterior probabilities greater than 95% are indicated by asterisks. (c) Multi-locus nuDNA networks generated using Pofad and SplitsTree. In all cases, samples are coloured according to northern (blue circles, nuDNA; blue stars, mtDNA) and southern (orange circles, nuDNA; orange stars, mtDNA) mitochondrial lineages. The populations of L. jungguy with sympatric mtDNA lineages are shown in pink. Pairwise distances for nuclear loci are given in electronic supplementary material, table S3.

