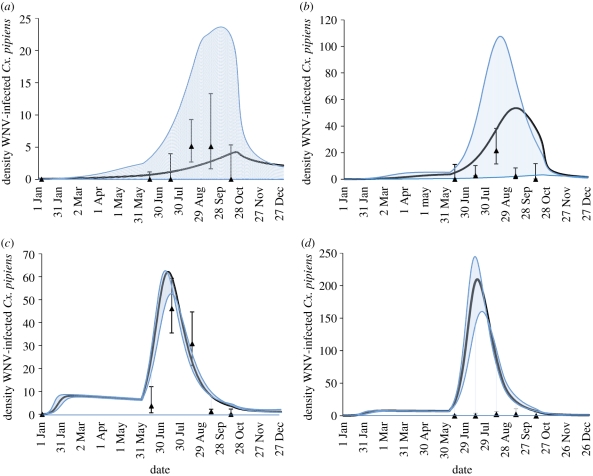
Figure 4.
Model results at baseline (black line), first (lower blue line) and third (upper blue line) quartiles (Q1 and Q3, respectively) from Latin hypercube sampling for the four sites in CT (A–D), along with 2006 Vector Indices (VI) represented as black triangles. (a) Site A, (b) site B, (c) site C, (d) site D. VI = monthly average maximum-likelihood estimate of infection prevalence × monthly average mosquito abundance. The lower (upper) error bar is derived from the lower (upper) limit of the MLE for infection prevalence multiplied by the monthly average mosquito abundance. Sites with low baseline αv had high variability, while sites with high baseline αv had less variability.

