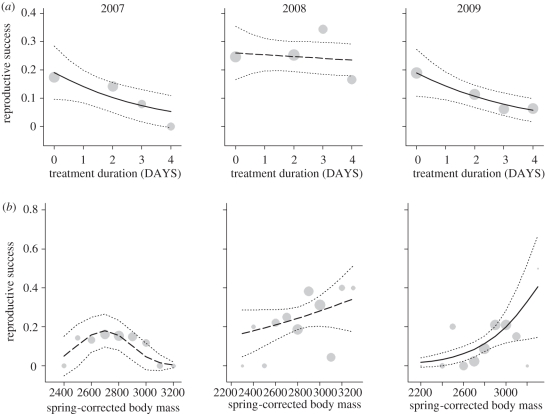
Figure 2.
Mean reproductive success (probability that a female was resighted in the subsequent autumn with at least one young) in relation to (a) the treatment duration (days maintained in captivity) or (b) with body mass in spring (body mass at capture controlled for body size and date), in 2007–2009. The fitted logistic models (black line when significant and long dashed otherwise) as well as its confidence interval at 95% (stippled line) are shown. Grey circle sizes are proportional to log (N) available for each days of treatment or body mass classes.

