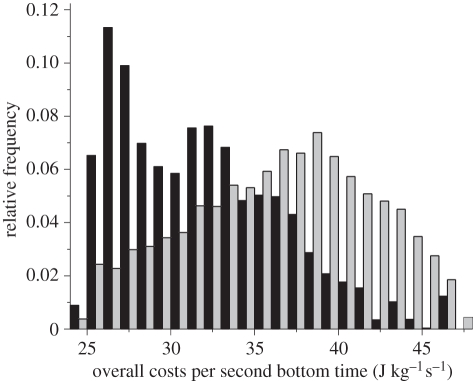
Figure 3.
Frequency usage of particular energy costs of foraging (mass-specific energy invested per second of bottom duration) resulting from the sea areas and depths frequented by imperial cormorants breeding at Punta Leon (black bars) compared with theoretical birds foraging, regularly spaced within the area available to imperial cormorants from the colony (grey bars).

