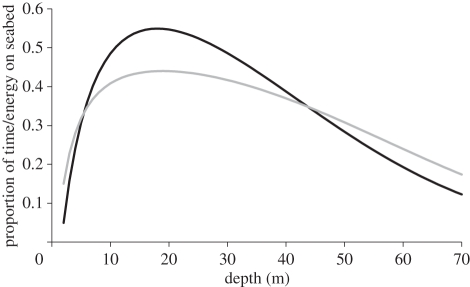
Figure 4.
Time- (black line) and energy-based (grey line) efficiency of imperial cormorant foraging as a function of depth based on the regressions shown in table 1. The graphs show the proportion of time or energy allocated to foraging along the seabed in relation to the total time, or energy, used in the full dive cycle.

