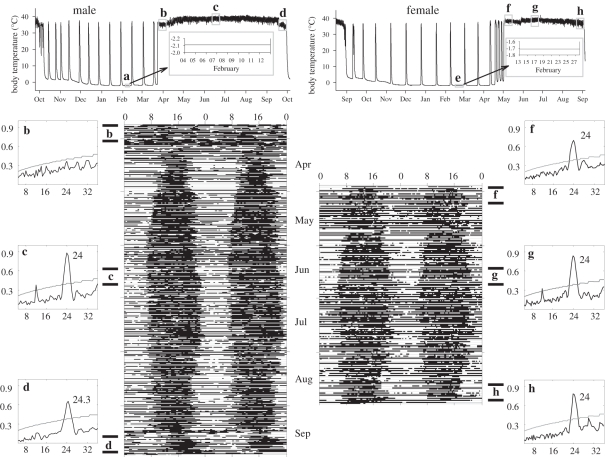
Figure 1.
Annual patterns of core Tb of a representative male and female arctic ground squirrel together with double-plotted actograms of when Tb remained at euthermic levels (each row represents two consecutive days). For actograms, the x-axis is the time of day (hour) and black bars indicate intervals when Tb was above the mean. Blocks indicated by a and e during heterothermy of hibernation are torpor intervals that are expanded in the insert indicated by the arrow; b indicates the prolonged interval of euthermic Tb that occurs in males after heterothermy ends but before they emerge from their burrows; f indicates the post-emergence interval in females; g and c are mid active season intervals; d indicates when this male remained in the burrow prior to first torpor; h is the pre-immergence interval in this female. Box graphs b–d and f–h show the F—periodograms for rhythms of Tb that correspond to 10 day intervals indicated on the actograms and Tb traces. Black lines indicate the strength of rhythms (Q); curved grey lines indicate 95% confidence limit.

