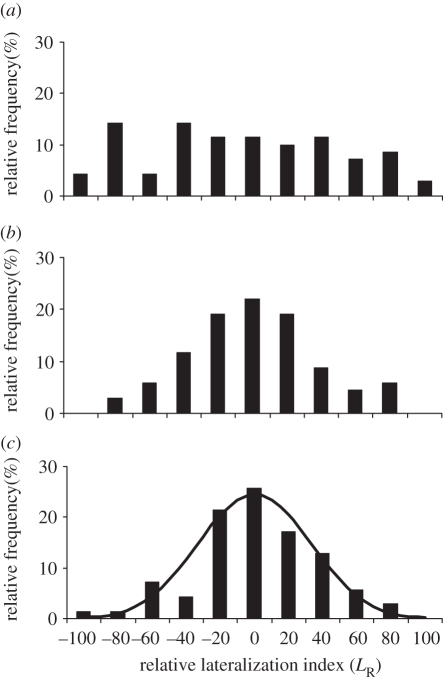
Figure 1.
(a) Relative frequency distributions of LR in control fish, (b) elevated-CO2 fish, (c) random simulation (bars) and random binomial distribution (curve). Positive and negative values indicate right and left turns, respectively. The extreme values of |100| indicate fish that turned in the same direction on all 10 trails.

