
Figure 2.
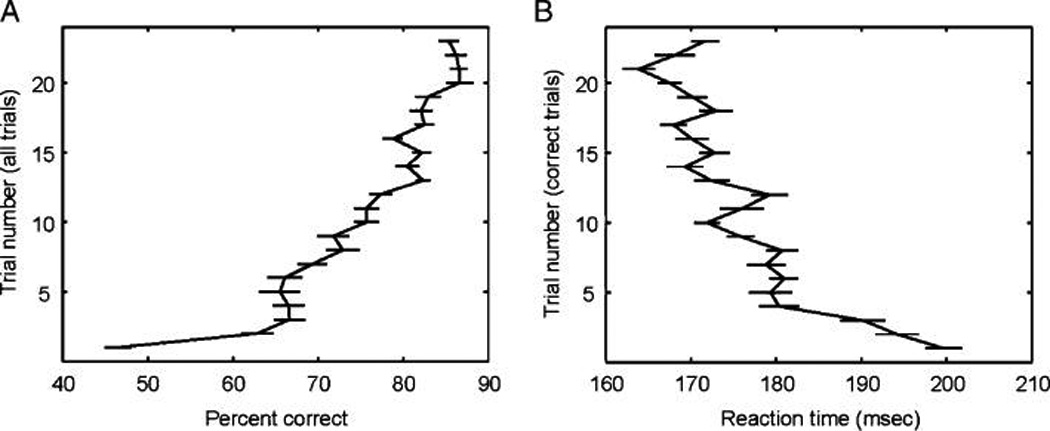
(A) Percentage of correct performance averaged across blocks and cues for all trials (correct plus error trials). At the start of a block (Trial 1), average performance is not above chance levels (50%) but quickly jumps above chance by the second presentation of each cue and continues to gradually improve throughout the block. (B) RTs averaged across blocks and cues for correct trials to match neural data from the two monkeys. RTs are slowest at the start of new blocks but rapidly improve over the first four trials and then continue to gradually improve over the remainder of the block. Error bars show SEM.