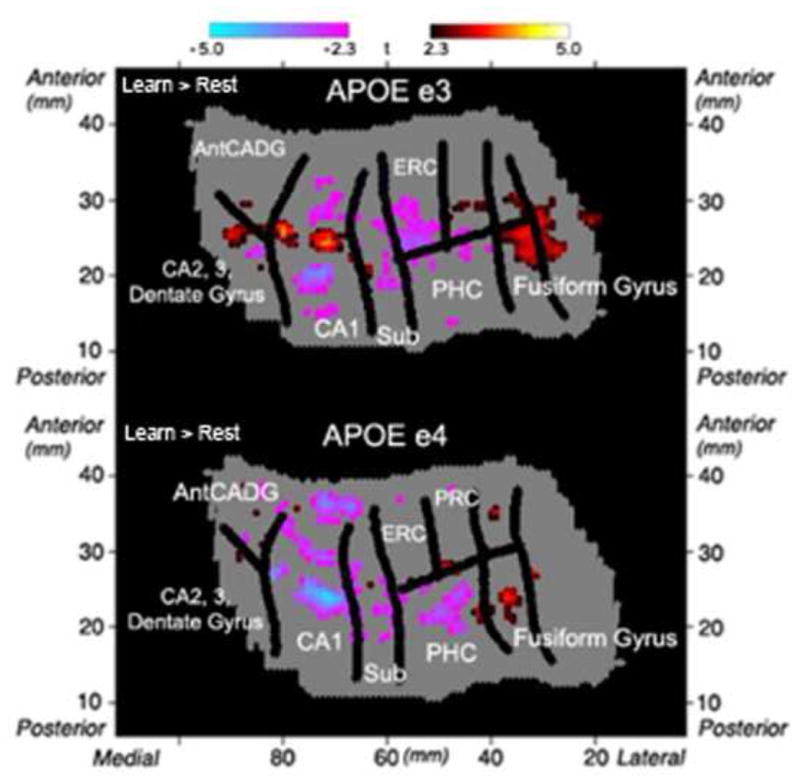
Fig. 4. Group Voxel-wise Analysis.

Group voxel based mixed-effects unfolded t-test maps (statistical maps of significantly activated and deactivated regions; learn > rest; −2.3 ≥ t ≥ 2.3, p < 0.05 corrected) in APOE e3 (n = 16) and APOE e4 (n = 16) carriers. Both groups showed significant increases and decreases compared to baseline within the left MTL regions during encoding of word-pairs. Regions shown include CA2,3 and dentate gyrus, anterior CA and dentate gyrus (AntCADG), CA1, subiculum (sub), entorhinal cortex (ERC), perirhinal cortex (PRC), parahippocampal cortex (PHC), and fusiform gyrus.
