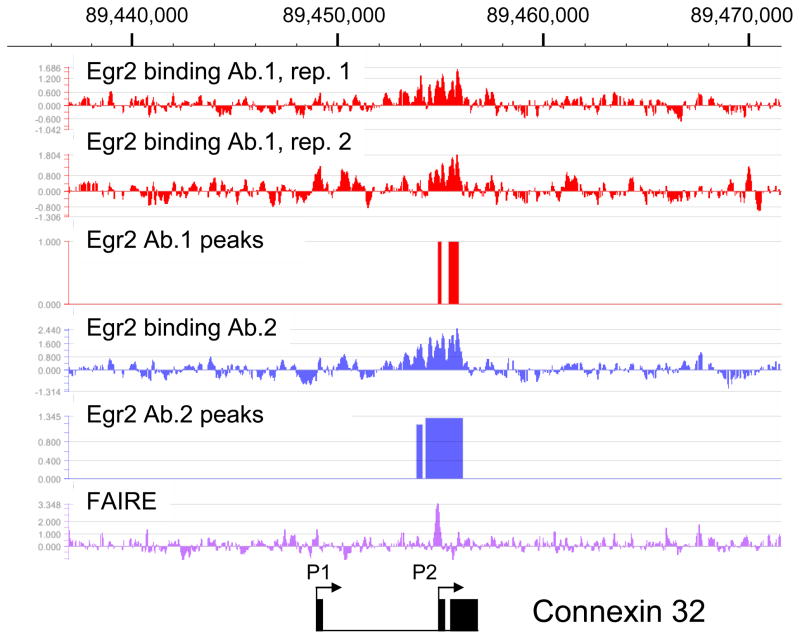
Figure 1. Egr2 binding in the Connexin 32 (Gjb1) locus.
Diagram shows peak data for binding of Egr2 within the rat Gjb1 locus on chromosome X. In vivo ChIP assays were performed on rat sciatic nerve at postnatal day 15 (P15) using two independent antibodies to Egr2. The ChIP samples were labeled with Cy5 (Egr2) or Cy3 (total input DNA) for hybridization to the genomic tiling array. The enrichment ratio of Cy5 to Cy3 was plotted on a log2 scale and further processed to display a 5 point moving average. The top two tracks show replicates of Egr2 antibody 1, and the 4th track shows an independent assay with Egr2 antibody 2. Peak analysis was performed as described in the Methods section at a false discovery rate of <0.05. The bottom track shows analysis of sciatic nerve chromatin using the FAIRE technique to identify disruptions in nucleosomal structure. The two alternate promoters in the Gjb1 locus are shown, along with the 3 exons (filled boxes). The P2 promoter is active in peripheral nerve.

