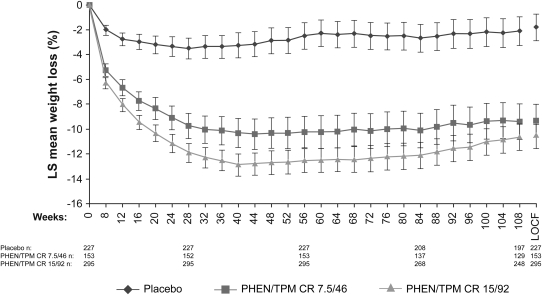
FIGURE 2.
Mean (95% CI) percentage weight loss from baseline to week 108. LS mean change in the overall study completer sample. Standardized lifestyle intervention was used across all treatment groups. P < 0.0001 compared with placebo at all time points assessed. LOCF, last observation carried forward; LS, least-squares; PHEN/TPM CR 7.5/46, 7.5 mg phentermine/46 mg controlled-release topiramate; PHEN/TPM CR 15/92, 15 mg phentermine/92 mg controlled-release topiramate.

