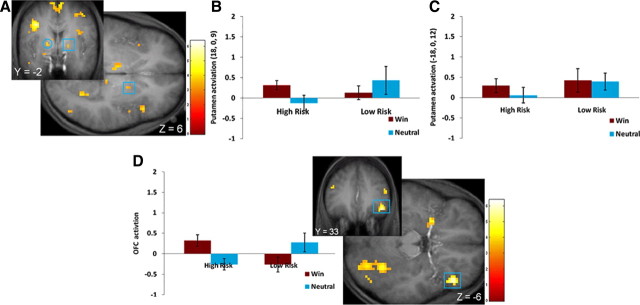
Figure 3.
A–D, Greater activation in high-risk versus low-risk group in response to the win–neutral display in the right putamen (A, square: 18, 0, 9; Z = 3.44; p = 0.018, FDR; k = 3), left putamen (circle: −18, 0, 12; Z = 3.74, p = 0.007, FDR, whole brain; k = 5) with bar graphs of the parameter estimates from those regions (B, right putamen; C, left putamen) and in the right orbitofrontal cortex (D: 45, 33, −6; Z = 5.61, p < 0.001, FDR; k = 16) with bar graphs of the parameter estimates from that voxel.

