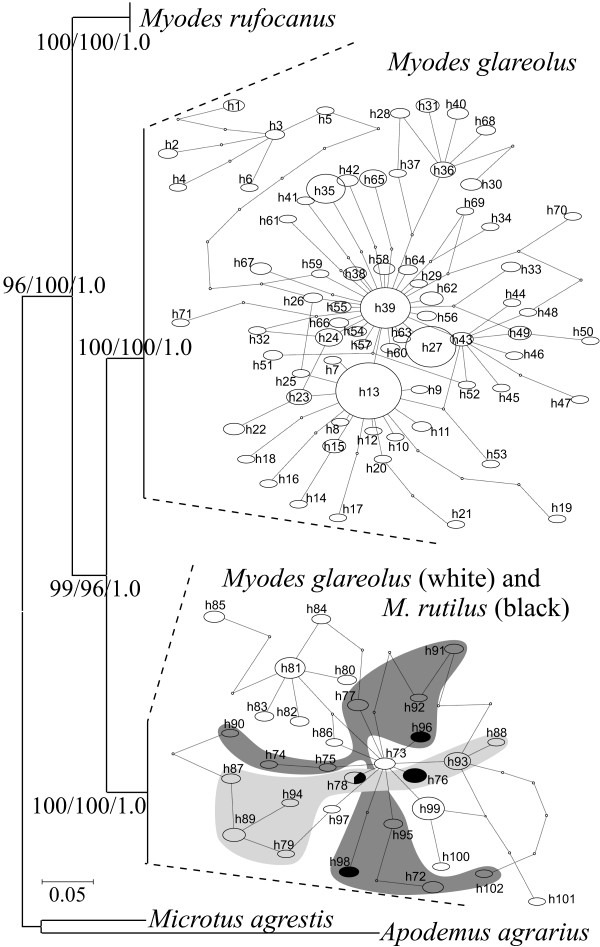
Figure 3.
Neighbour Joining (NJ) trees for cytochrome b. Numbers in the species nodes represents percentage of bootstrap values for 1000 pseudo replicates for NJ and maximum likelihood analyses and Bayesian posterior probabilities. For simplicity the tree is collapsed into the major clades. Branch length is proportional to the number of substitutions per site. Haplotype networks for mtDNA of native (GLA) and introgressed Myodes glareolus (RUT) together with M. rutilus are presented separately. Oval sizes are proportional to the number of sampled individuals. Points on the branches indicate hypothetical haplotypes. Shadings for the introgressed haplotypes refer to populations: light gray - 4, Sotkamo (CE), dark gray - 6, Savukoski (NE), no shading - 5, Kolari (NW). Trees were rooted with sequences downloaded from GenBank (Microtus agrestis and Apodemus agrarius, AY167187 and AB303226).

