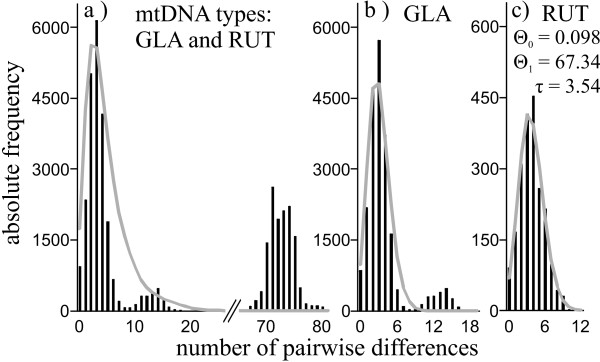
Figure 4.
Observed (black bars) and expected (gray lines) mismatch distributions. Figures include: a) all samples of bank voles, Myodes glareolus, b) bank voles with native mtDNA type (GLA) and c) bank voles with mtDNA type of red voles M. rutilus (RUT). Values of the expansion parameters are only shown if the assumptions of the Sudden Expansion Model are fulfilled (unimodal distribution and goodness of fit test: p > 0.05).

