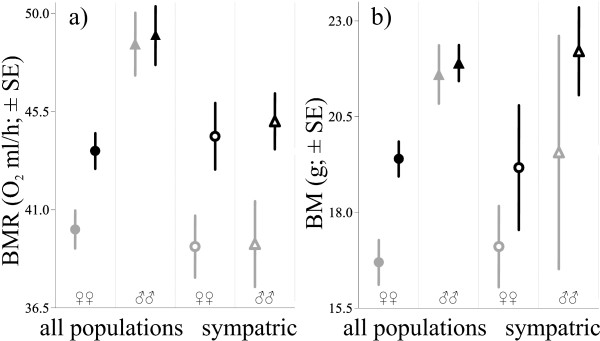
Figure 5.
Differences in phenotype between mitotypes. Differences in means (± SE) of a) basal metabolism (BMR) and b) body mass (BM), between native (black) and introgressed (gray) mtDNA types in Myodes glareolus. Data are presented separately for females (circles) and males (triangles) captured in allopatric (filled) or sympatric populations (open figures).

