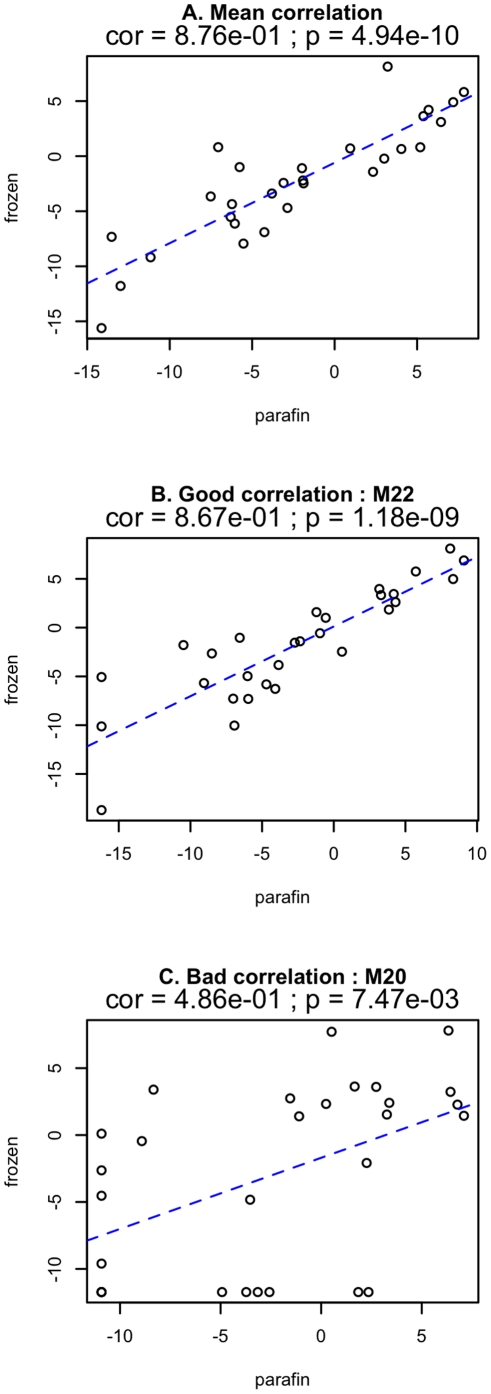
Figure 2. Frozen/FFPE correlations.
a. Correlation in all the patients and for all the genes between the two tissue preparation methods. The adjusted Pearson correlation between FFPE and frozen tissue for all tested genes was greater (Pearson coefficient = 0.88 p<0,0001). b. Two examples of correlations determined individually for each patient measured in all genes.

