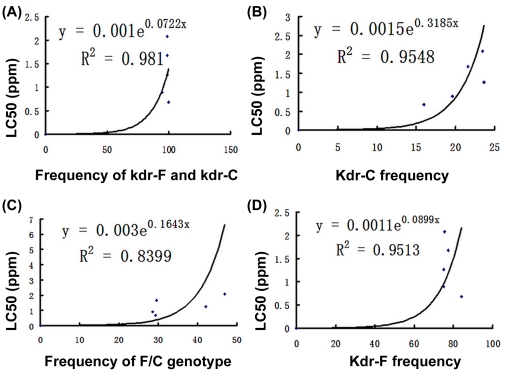
Figure 6. Correlation between LC50 and percentage frequencies for kdr alleles and genotypes.
(A), (B), (C), (D): exponential correlation relationship between frequencies of kdr-F and kdr-C, kdr-C, F/C genotype, kdr-F genotype and the 50% lethal concentration of the five populations against beta-cypermethrin.

