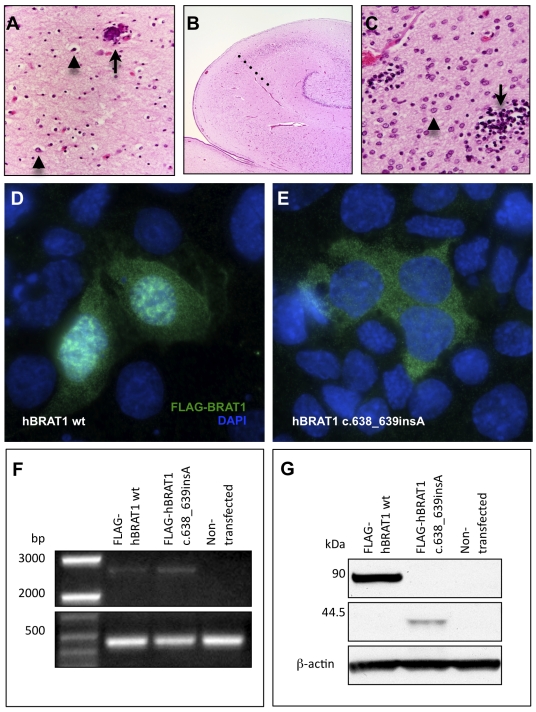
Figure 1. Corticobasal degeneration in the brain of an infant who died from a homozygous BRAT1 mutation.
(A) Throughout frontal, occipital and temporal cortex, there is marked neuronal loss, gliosis with astrocytes (arrowheads) and swollen oligodendroglia. The arrow indicates a perivascular microcalcification (superior frontal gyrus, deep cortex, 10×). (B) The anterior hippocampus is smaller than expected and there is neuronal loss and gliosis in zone CA-1 (Sommer's sector), demarcated from the CA-2 sector by the dotted line (4×). (C) At 60× magnification, the putamen shows a paucity of neurons, abundant Alzheimer Type 2 astrocytes (arrowhead) and scattered microglial nodules (arrow). Heterologous overexpression of N-terminal FLAG-tagged human BRAT1 (D) and hBRAT1 c.638_639insA (E) in mouse IMCD3 cells. Wild-type Brat1 localizes to the nucleus and cytoplasm of mIMCD3 cells. Mutant Brat1 (c.638_639insA) does not localize to the nucleus and instead forms punctate aggregations in the cytoplasm. Similar results were obtained in hARPE-19 cells (data not shown). (F) RT-PCR demonstrating the stability of overexpressed human BRAT1 transcripts (∼2.6 kb) in hARPE-19 cells. A B-actin amplicon (∼450 bp) was used as a loading control on the same gel. (G) Western blot of lysates from human ARPE-19 cells transiently transfected with wt hBRAT1 displaying FLAG-hBRAT1 fusion protein at ∼90 kDa or with hBRAT1 c.638_639insA displaying the truncated FLAG-hBRAT1 mutant fusion protein at ∼44.5 kDa (FLAG-tag and linker = 3.1 kDa). B-actin was labeled as a loading control.

