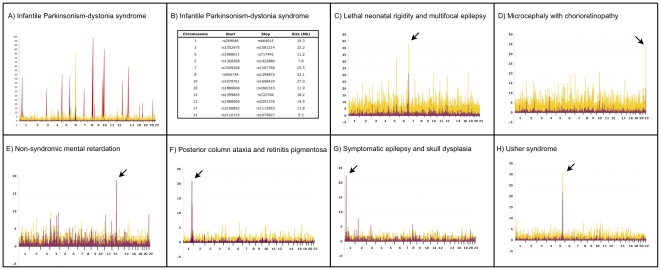
Figure 4. Genetic mapping of seven Plain disorders.
The results of autozygosity mapping using Affymetrix GeneChip 10 K or 50 K SNP microarrays are plotted for each disorder. The x-axis depicts chromosomal location on autosomes. Yellow peaks represent the number of contiguous homozygous SNPs shared by affected individuals and the purple peaks depict location scores. (A) Autozygosity mapping of two affected individuals identified a single, large block of homozygosity on chromosome 6 (yellow peak). Genotyping of 6 unaffected siblings excluded this homozygous block, but identified 12 genomic regions greater than 5 Mb in size (red peaks) that were consistent with linkage in the family. (B) List of genomic regions consistent with linkage in the single nuclear family with infantile parkinsonism-dystonia syndrome. Panels C–H provide mapping plots for the other 6 disorders. For two disorders (C,D), 50 K microarrays were used after 10 K microarrays failed to unequivocally localize the disease gene. The other four disorders (E–H) were mapped with 10 K microarrays.

