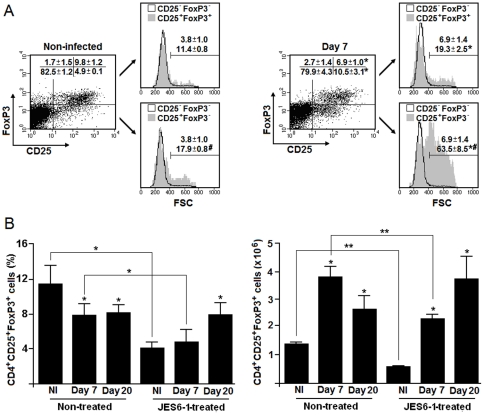
Figure 4. Effects of JES6-1 treatment on the splenic CD4+CD25+FoxP3+ cell population during P. chabaudi malaria.
(A) C57BL/6 mice were infected with 106 PRBC. On day 7 p.i., CD4+ T cells were analyzed for CD25 and FoxP3 expression and cell size (FSC). Dot plots represent gated CD4+ T cells. Dot plots and histograms show a representative mouse from each group. Numbers inside dot plots refer to means ± SD (n = 4) of cell percentages in each gate. Histograms show gated CD4+CD25+FoxP3+ and CD4+CD25+FoxP3− cells in relation to CD4+CD25−FoxP3− cells. Numbers inside histograms refer to means ± SD (n = 4) of large cell percentages. (B) On days 0, 2 and 4 p.i., C57BL/6 mice were treated with JES6-1 mAb. Data represent the means ± SD (n = 4) of CD4+CD25+FoxP3+ cell percentages and numbers per spleen on days 7 and 20 of infection. In A–B, significant differences compared experimental conditions *p<0.05 with cells from non-infected (NI) mice; **p<0.05 with cells from non-treated (NT) mice; and #p<0.05 with CD25+FoxP3+ cells. Data are representative of two separate experiments.

