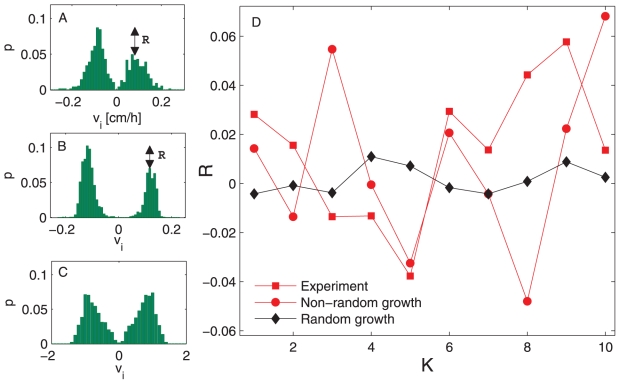
Figure 4. The binomial distributions and the indicator of direction of the growing roots .
 . The sample bimodal distribution calculated from the: A. experiment; B. non-random model; and C. model of random growth. Double arrows mark the difference between maxima of bimodal distributions. This difference defines the value of
  . D. The indicator of direction of the growing roots,
  , exhibits high variations in the case of non-random growth, both in experiments and numerical simulations, and low variations in the case of random-growth model. The parameter values used in B and C are as in Fig. 3 B and C, respectively.
  stands for experiment number.

