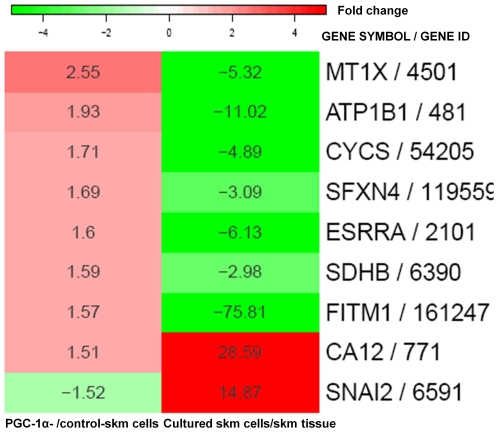
Figure 2. Genes regulated by both PGC-1α-overexpression in cultured skm cells and skm cultures in comparison to skm tissue.
Heat map including the genes (Gene symbol/Gene ID for Entrez Gene) in Table 1 (PGC-1α- versus control-skm cells) that were also found to be differentially expressed after human skm culture according to Table S2 from [25] (cultured skm cells versus skm tissue). Each cell displays the absolute fold change in the corresponding comparison and is filled according to the color gradient shown at the top (green and red for down and upregulated genes, respectively).

