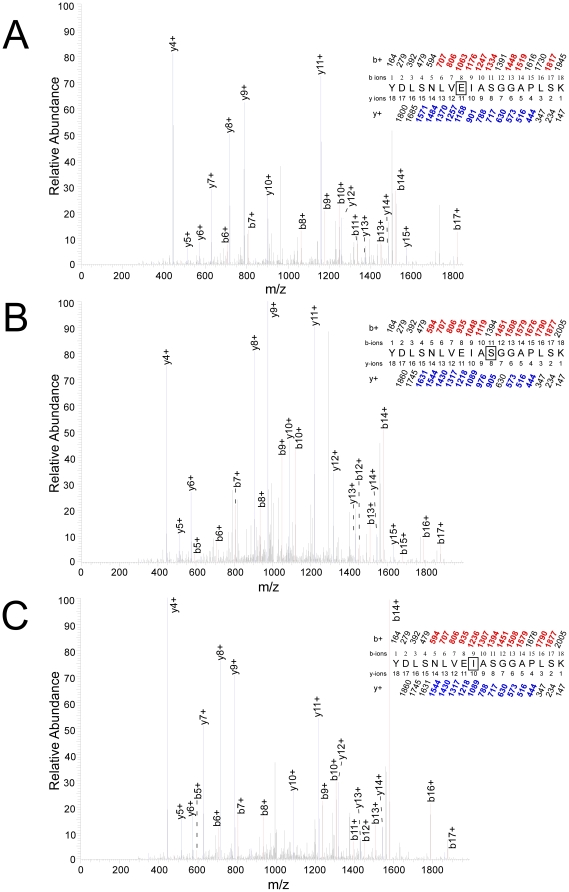
Figure 4. Identification of photolabeled residues in the peptide Tyr-306– Lys-324.
The site of photoincorporation of photolabels was inferred from these MSMS spectrum. In the insets, the predicted charge/mass ratios of ions with an intact N-terminus (b-ions) or C-terminus (y-ions) are shown above and below the sequence, respectively, with the indicated charge. The photolabeled residue is boxed and the experimentally observed values are colored (b-ions in red and y-ions in blue) and in bold and their position indicated on the spectrum. Luciferase was photolabeled after exposure to ATP (2 mM)+photolabel for 200 ms. A. 3-azioctanol (100 µM) photolabels Glu-313. B. TFD-benzyl alcohol (100 µM) photolabels Ser-316. C. TFD-benzyl alcohol (100 µM) photolabels Ile-314.

