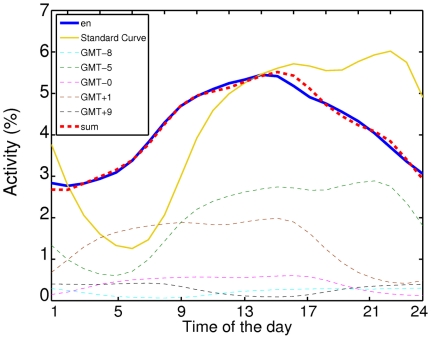
Figure 3. Decomposition of activity pattern of English WP into 5 shifted standard curves with different weights.
The blue line is the empirical data, the yellow curve is the standard curve (see the text for the definition), the thin dotted lines are shifted and weighted standard curves, and the red dotted line is the linear superposition of them which models the empirical data properly.

