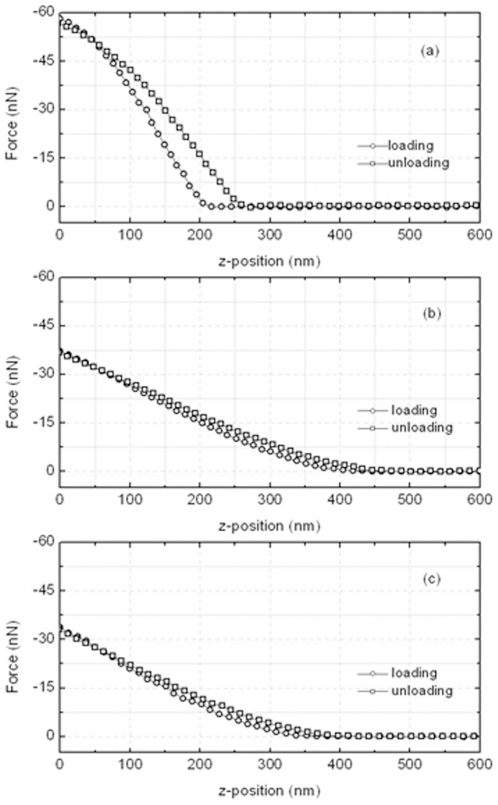
Figure 5. Force distance curve for control (a), treated Ishikawa (b) and HeLa (c) cells.
The force of cantilever was plotted as a function of the probe position in the z-direction. The open circle and rectangle show the loading and unloading processes, respectively. The loading curve after the AFM tip approached closely or contacted the sample surface, which gives the information of the sample property.

