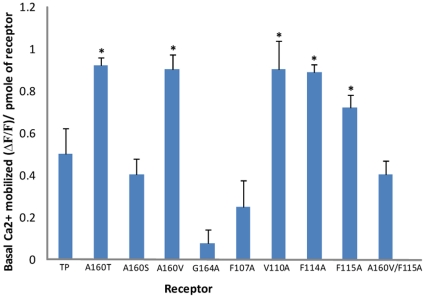
Figure 5. Characterization of basal or agonist-independent activity.
Bar plot representation of the basal amount of calcium released by TP and mutants per picomole of functional protein expressed (see methods). The G164V mutant could not be assessed as it did not bind to the antagonist, and the amount of functional receptor could not be calculated. Results are obtained from a minimum of two independent experiments done in duplicate. The single astrix indicate there is a significant difference in the amount of calcium released at zero concentration of agonist with respect to wild type TP at significance level p<0.05. Error bars indicate mean ± SD.

