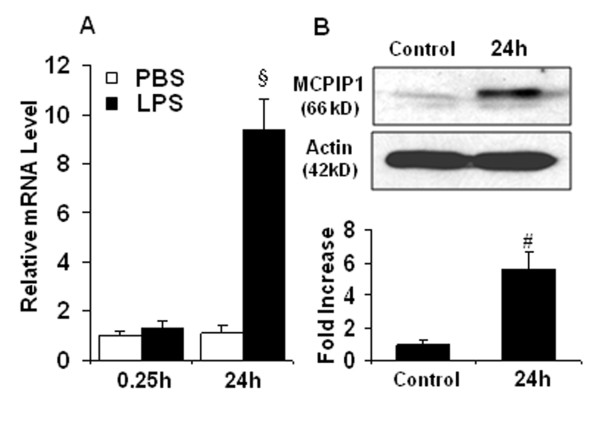
Figure 2.
MCPIP1 mRNA and protein increase in human microglia treated with LPS. (A) MCPIP1 mRNA expression in human microglia treated with LPS (0.1 μg/ml) as measured by qRT-PCR. Values represent mean ± SD, § p < 0.001 versus PBS control. (B) MCPIP1 protein levels in human microglia treated with LPS (0.1 μg/ml) as measured by Western blot. Results are representative of three independent experiments. # p < 0.01 versus PBS control.

