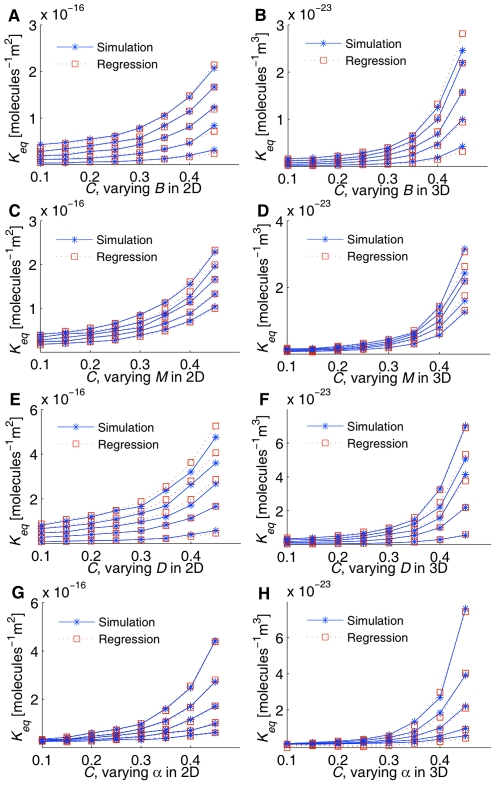
Figure 5. Simulation vs. Regression for Keq in 2D and 3D.
(A, B) varying parameter B (0.1 bottom, 0.3, 0.5, 0.7, 0.9 top), (C, D) varying parameter M (0.6 bottom, 0.8, 1.0, 1.2, 1.4 ns top), (E, F) varying parameter D (1.95 bottom, 6.95, 11.95, 16.95, 21.95×10⁻¹¹ m2s−1 top) for 2D and (1.3 bottom, 4.63, 7.97, 11.3, 14.63×10⁻¹¹ m2s−1 top) for 3D cases, (G, H) varying parameter α (1.6 top, 1.8, 2.0, 2.2, 2.4 bottom). The first column (A,C,E,G) shows 2D cases and the second column (B,D,F,H) shows 3D cases. Simulation curves show averages from 10 independent runs for 3D and 30 independent runs for 2D at 5 time points (5, 10, 15, 20, 25 µs) per run for fixed CR = 0.1 and varying CI (0.0, 0.05, 0.1, 0.15, 0.2, 0.25, 0.3, 0.35).

