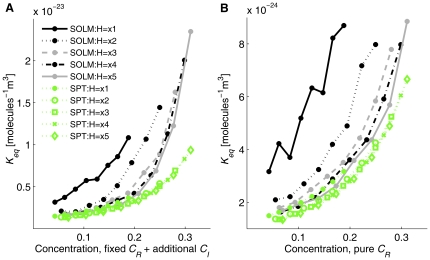
Figure 6. Keq from SOLM and SPT for variable heights of the simulation space.
(A) Keq from SOLM and SPT for fixed amount of CR+ additional CI, (B) Keq from SOLM and SPT for pure CR without inert crowding agents. Simulation boxes have length and width of 50 nm in all cases. Five different heights are examined: 5.125 nm (single particle layer with threshold distance, x1), 10.25 nm (double layer, x2), 15.375 nm (x3), 20.5 nm (x4), 25.625 nm (x5). Note that this figure uses concentrations corrected for boundary effects to label the x-axis in contrast to the other figures, in order to better illustrate the trend across concentrations.

