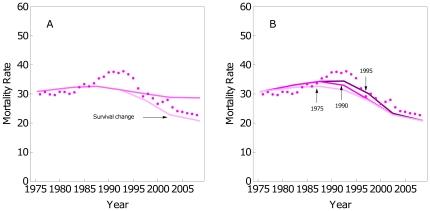
Figure 3. Sensitivity analysis.
Standardized BC mortality rates for the age group 30–69. Observed rates (dots) and estimations for All interventions scenario. A) Changing the BC survival pdfs by the US pdfs for women diagnosed since 1995. B) Changing the year of introduction of adjuvant treatments: 1975, 1990, and 1995 (from bottom to top).

