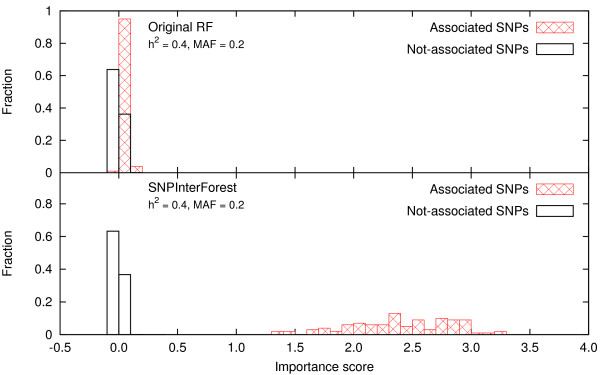
Figure 2.
Distribution of the importance score compared with the original RF. Distribution of the importance score which is computed by permutation testing for a simple model of pure epistatic interactions. The upper panel shows the results from the original random forest, and the lower panel shows the result from SNPInterForest. The SNPs associated with disease are represented by red boxes, and the other SNPs are represented by black boxes.

