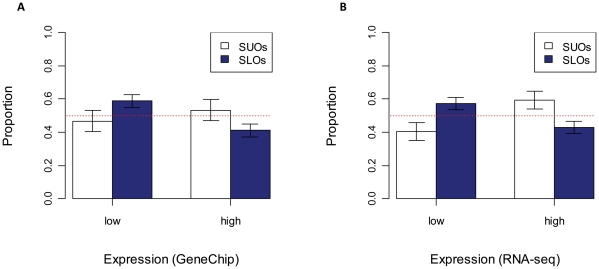
Figure 6. Gene expression data analyses for SUOs and SLOs in mouse ESCs.
(A) Gene expression data based on GeneChip technology. (B) Gene expression data based on RNA-seq technology. In both (A) and (B), SUOs and SLOs are divided into ‘low’ and ‘high’ expression genes in mouse ESCs based on the median expression level of all genes > 10 kb. The red dotted line shows the 50% level, which is the proportion taken by lowly/highly expressed genes for all genes > 10 kb in mouse ESCs. Error bars are standard errors derived from the total number of genes (sample size) in each gene set.

