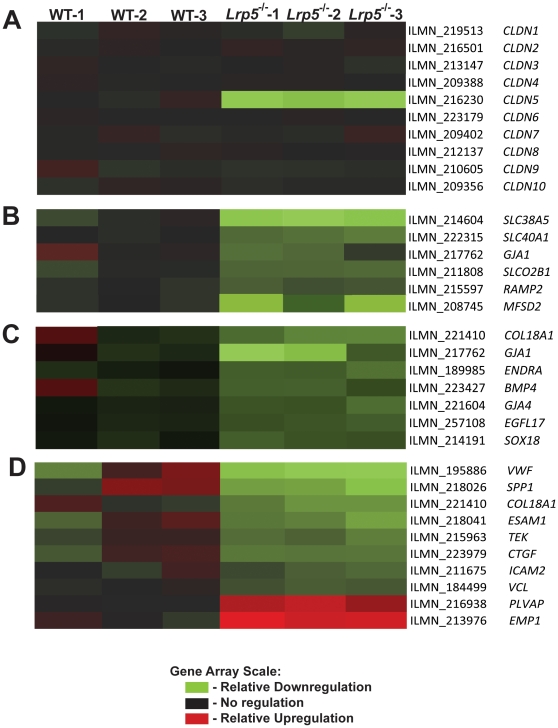
Figure 4. Regulation of tight junction, membrane transport, angiogenic, and cell adhesion genes in the Lrp5 null retina.
Heat maps illustrate the results of a gene array run from whole retinal total mRNA. The most regulated families of genes were (A) claudin family genes, (B) membrane transport genes, (C) angiogenic regulatory genes, and (D) cell adhesion/cell-cell junction genes. Each sample is represented by a block: either wild-type (WT) samples 1 through 3, and Lrp5 null samples 1–3. Relative down-regulation of expression in Lrp5 null retina compared to WT retina is represented by green, while relative up-regulation is in red. No relative regulation is black (See scale on Figure).

