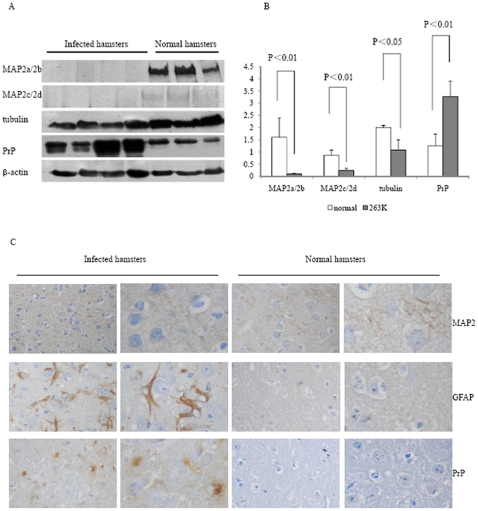
Figure 1. Comparative analyses of the levels of MAP2 in brain tissues of normal and 263K-infected hamsters.
A. Western blots. Same amounts of individual brain homogenate were loaded in 6% or 12% SDS-PAGE and various specific immunoblots were marked on the left side of the graphs. B. Quantitative analysis of each gray numerical value of MAP2a/2b, MAP2c, 2d, tubulin and total PrP vs that of individual β-actin. The average values were calculated from four individual infected hamsters or three individual normal hamsters and presented as mean ± SD. Statistical differences compared with controls were illustrated as P<0.05 or P<0.01. C. IHC assays of MAP2, total PrP and GFAP in cortex of normal and 263K-infected hamsters. The magnifications are ×20 in the left row and ×40 in the right row.

