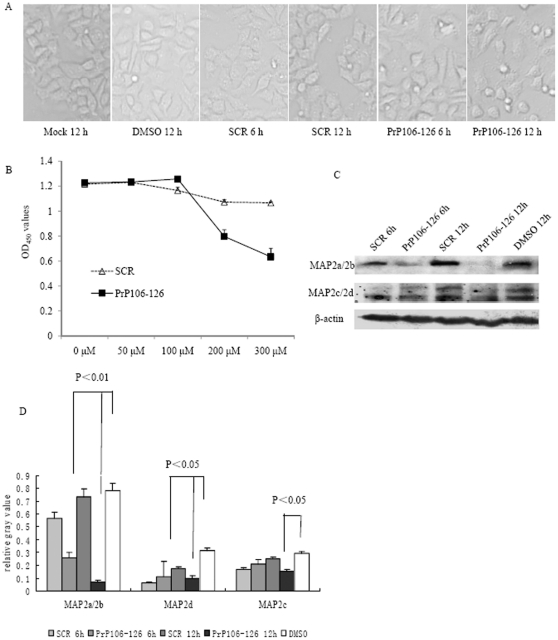
Figure 4. Analyses of the MAP2 levels in SK-N-SH cells exposed to PrP106–126.
A. SK-N-SH cells were treated with 200 µM of PrP106–126, scrambled peptide PrP106–126 (SCR) or DMSO for 6 h and 12 h. The treated cells were photographed with a light microscope (×20). B. Cell viability after exposed to different concentrations of PrP106–126 or SCR. The average data of each preparation was calculated based on three independent experiments and represented as mean ± S.D. C. Western blots of MAP2a/2b, MAP2c, 2d and β-actin in SK-N-SH cells after treated with 200 µM of PrP106–126, SCR or DMSO for 6 h and 12 h. D. Quantitative analyses of each gray numerical value of MAP2a/2b, MAP2c, 2d vs that of individual β-actin. The average relative gray value is calculated from three independent blots and presented as mean ± S.D. Statistical differences compared with controls are illustrated as P<0.05 and P<0.01.

