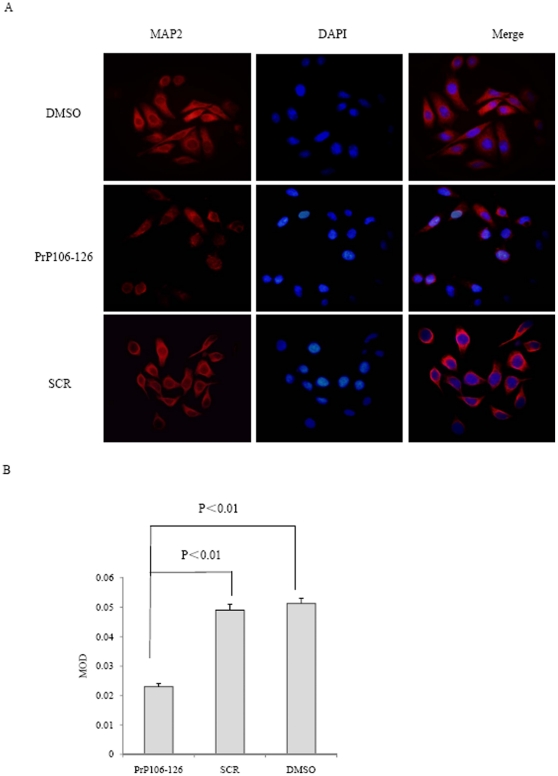
Figure 5. Immunofluorescent assays of MAP2 on PrP106–126 treated SK-N-SH cells.
A. Immunofluorescence images of the cells were exposed to DMSO (upper), PrP106–126 (middle) or SCR (lower) for 6 h. The images of MAP2 (red), DAPI (blue) and merge are indicated above. B. Quantitative analysis of fluorescence intensity of MAP2 in the cells. MOD data each preparation is calculated from three independent images and presented as mean ± S.D. Statistical differences is illustrated as P<0.01.

