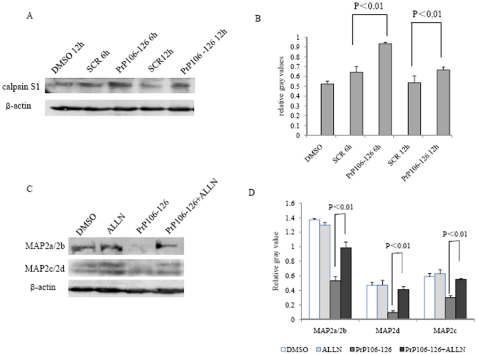
Figure 7. Analyses of calpain levels in PrP106–126 treated SK-N-SH cells.
A. Western blots of calpain in cells exposed to DMSO, PrP106–126 or SCR. B. Quantitative analyses of the gray numerical values of calpain. The average relative gray value is calculated from three independent blots and presented as mean ± S.D. Statistical differences are illustrated as P<0.01. C. Western blots of MAP2 in the cells treated with PrP106–126 alone and PrP106–126 plus calpain inhibitor ALLN. D. Quantitative analyses of the gray numerical values of MAP2a/2b, MAP2d and MAP2c. The average relative gray value is calculated from three independent blots and presented as mean ± S.D. Statistical differences are illustrated as P<0.01.

