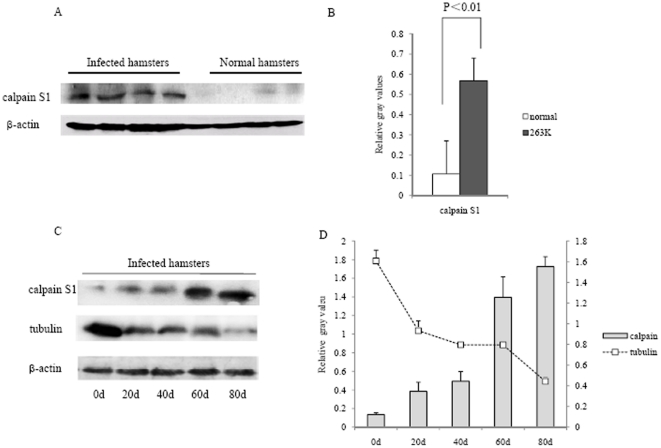
Figure 8. Analyses of calpain levels in the brain tissues of 263K-infected hamsters.
A. Western blots of calpain in the infected and normal hamsters. B. Quantitative analyses of the gray numerical values of calpain. The average gray values were calculated from four infected hamsters or or four normal after normalized with that of individual β-actin and presented as mean ± SD. Statistical difference is illustrated as P<0.01. C. Western blots of calpain and tubulin in the brain tissues of 263K-infected hamsters on 0, 20, 40, 60 and 80 dpi. D. Quantitative analyses of the gray numerical values of calpain and tubulin vs that of individual β-actin. The average relative gray value is calculated from three independent blots and presented as mean ± S.D.

